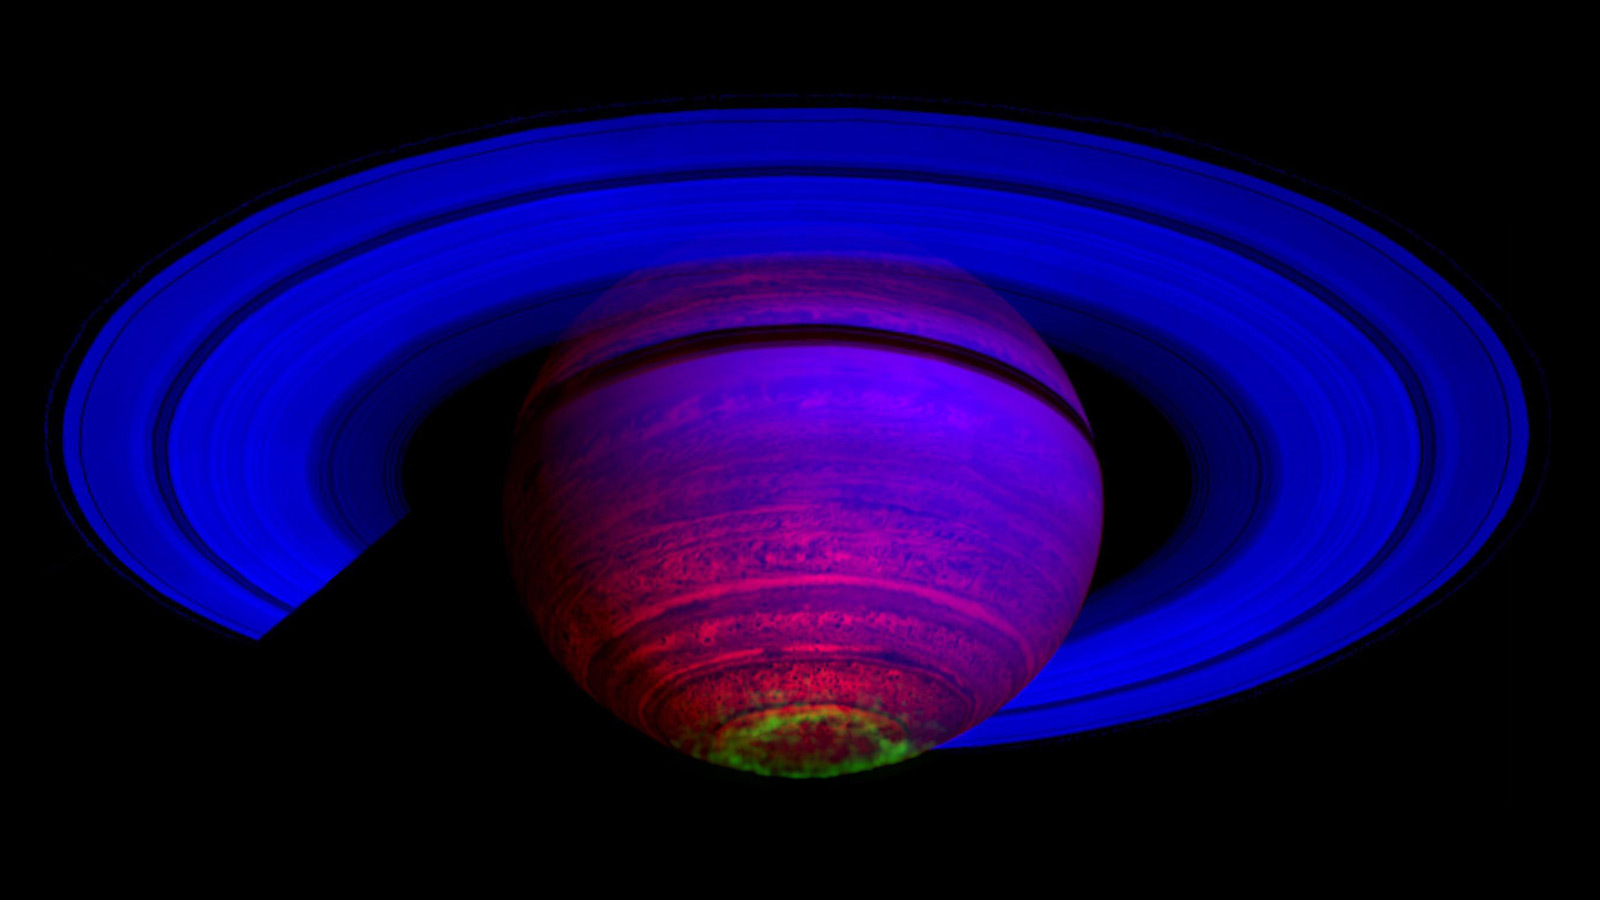
This false-color composite image, constructed from data obtained by NASA's Cassini spacecraft, shows the glow of auroras streaking out about 1,000 kilometers (600 miles) from the cloud tops of Saturn's south polar region. It is among the first images released from a study that identifies images showing auroral emissions out of the entire catalogue of images taken by Cassini's visual and infrared mapping spectrometer. More ›
How It Worked
The Visible and Infrared Mapping Spectrometer (VIMS) collected both light that is visible to humans and infrared light of slightly longer wavelengths. It separated the light into its various wavelengths so scientists could learn about the composition of materials from which the light is reflected or emitted.
How We Used It
Scientists used VIMS to determine the content and temperatures of atmospheres, rings and surfaces in the Saturn system. The instrument analyzed light but scientists also created images from its data, similar to a visible-light camera.
If you looked at a ball of rubber bands the size of a soccerball, you’d have a hard time accurately observing all the kinds of rubber bands, what colors they were, or how strong they were. But if you took the ball apart and lined up the rubber bands in a row, you could learn all of the above.
That’s sort of what a spectrometer does to light. VIMS used lenses, mirrors and other hardware to take light apart and spread it out into a tidy row of 352 separate colors, kind of like a rainbow, so that scientists can see which wavelengths are present, which ones are absent, and which ones are stronger or weaker. From that information, scientists can learn what something is made of, be it a briny lake on Titan or the rings of Saturn.
VIMS was two cameras in a single instrument: one measured visible wavelengths, the other measured infrared, and they helped scientists study the composition of Saturn’s ring and moons, and the atmospheres of Saturn and Titan, among other things. For atmospheres like those of Saturn and Titan, the altitudes and thicknesses of clouds and hazes could sometimes be determined, and the glow of auroral emissions could also be mapped in Saturn’s polar regions.
When Cassini arrived at Saturn in 2004, the instrument helped scientists quickly discover what appeared to be an ice volcano on the moon Titan and fresh ice along the “tiger stripe” fractures on the moon Enceladus. The instrument also found carbon dioxide ice on Phoebe, a small moon very distant from Saturn. “That suggested to us that it formed in a cold area in the solar system,” said Bonnie Buratti, a senior research scientist at NASA’s Jet Propulsion Laboratory. The carbon dioxide is consistent with other evidence that Phoebe originated in the Kuiper Belt beyond Netune's orbit, but was dislodged, then wandered too close to Saturn and was captured. But VIMS was just getting started.
Some scientists thought the lakes detected near Titan’s north pole might in fact be dry lake beds or very smooth plains. But the VIMS team settled the matter when the instrument imaged sunlight glinting off of what were clearly liquid lakes, the same way sunlight reflects in lakes on Earth when viewed from the International Space Station.
The team also found that Titan is home to a lot of ethane and other hydrocarbons in addition to methane. “Cassini showed us how complex the surface of Titan was. It’s almost Earth-like,” Buratti said. VIMS scientist Kevin Baines, a JPL planetary scientist, thinks future spacecraft could use Titan as a refueling station for interplanetary explorers. “A couple hundred years from now, you’re going to have spacecraft landing on Titan and tanking up some of the liquid methane and ethane that sits there in the ponds and lakes that are strewn over the northern region like the fabled 10,000 lakes of Minnesota,” he said.
Baines is thrilled by what the instrument observed, such as the hexagon on Saturn’s north pole. “The hexagon was first clearly imaged by VIMS. Inside the hexagon we discovered a vortex centered at the pole, like a giant hurricane bigger than the diameter of Earth,” he said. “It was the dark of winter and so, like on Earth, the pole was in a long wintertime night that on Saturn lasts more than a decade, but VIMS can see clouds at night in the near-infrared.” The spacecraft’s visible-light camera, on the other hand, had to wait another four years before Saturn’s northern pole tilted enough toward the sun to allow a visible-light photograph.
“We’ve been able to map the size and temperature of the hotspots on Enceladus,” Buratti said. “The hotspots appear to be about 200 Kelvin [minus 100 Farenheit, or minus 73 degrees Celsius],” she said. “They’re hotter and smaller than we thought they were.” The hotspots are the apparent sources of heat that produce the now-famous plume of water vapor, ice particles and simple organic compounds above the south polar region of Enceladus. “They’re almost certainly coming from a liquid ocean,” Buratti said.
On Earth, hotspots in the ocean floor can produce thermal vents, and many scientists suspect that life on Earth began around these undersea environments. Cassini’s VIMS instrument provided vital clues about whether similar habitable zones are waiting beneath the ice of Enceladus.
At a Glance
VIMS included a pair of imaging grating spectrometers that were designed to measure reflected and emitted radiation from atmospheres, rings and surfaces to determine their compositions, temperatures and structures.
- Visible Channel [VIMS-V] (0.35 to 1.07 µm [96 channels]; 32x32 mrad field of view)
- Infrared Channel [VIMS-IR] (0.85 to 5.1 µm [256 channels]; 32x32 mrad field of view)
- Mass: 37.14 kg
- Peak Operating Power: 27.20 W
- Average Operating Power: 21.83 W
- Peak Data Rate: 182.784 kilobits/sec
- Dimensions: 78 cm x 76 cm x 55 cm


