|
Mass spectrometers are analytical instruments
that determine atomic and molecular masses with great accuracy.
Low-pressure vapors of elements or molecules are hit by a
beam of rapidly moving electrons. The collision knocks an
electron off the sample atom or molecule, leaving it positively
charged.
These newly-formed ions are accelerated out
of the ionization chamber by an electric field. The speeds
to which the ions can be accelerated by the electric field
are determined by their masses. Lighter ions can go faster
than heavier ones.

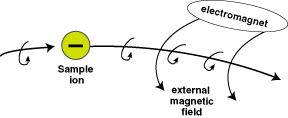
Ion's path bent by external magnetic field
Courtesy: McREL |
The beam of positively-charged ions generates
a slight magnetic field that interacts with an externally-applied
magnetic field. The net result is that the trajectory of a
charged particle is curved to an extent that depends on its
speed (determined by its mass). When the beam of a mixture
of isotopes of different masses falls on a photographic plate,
the different isotopes converge at different points, corresponding
to the different radii of their semicircular paths.
The mathematical equation that describes this
phenomenon is: m/e = H2 r2 /2V, where
m is the mass of the ion, e is the charge of the ion, H is
the magnetic field strength, r is the radius of the semicircle,
and V is the accelerating potential.
The radius of the semicircular path is proportional
to the mass of the particle. A photographically-detected mass
spectrum of natural germanium obtained under conditions of
constant magnetic field and accelerating potential would look
like the figure shown below:

Atomic mass units |
The relative abundances of the ions can be determined
from the densities of the photographic images they produce.
On most spectrometer graphs the mass in amu's
or atomic mass units is plotted on the x-axis
and relative intensity of the ion stream is plotted on the
y-axis. The relative intensity is a measure of how many ions
of any given mass are detected.
With modern low-resolution instruments, one
can expect to obtain an accuracy level of plus or minus 1
amu up to 1000 atomic mass units. High-resolution instruments
can provide an accuracy of 2-3 parts per million (ppm) up
to masses of 3000 amu.
Since H, V, and r can be controlled experimentally,
the ratio m/e can be determined in one of several fashions.
In a typical modern mass spectrometric experiment the strength
of the external magnet is slowly varied, causing the paths
of the various particles to sweep past an exit point where
the mass spectrometer's ion detector is located. In other
words, a signal is produced at the detector when the magnetic
field is just strong enough to bend the pathway of charged
particles of a given mass so that they arrive at the detector.
The mass of the ion detected is then calculated from the accelerating
voltage and the strength of the magnetic field required to
produce the signal.
The mass spectrum is a graph of intensity of
detector signal versus magnetic field strength. The positions
of the peaks on the graph are used to calculate the masses
of the ions, and the relative heights of the peaks indicate
the relative proportions of the ions of various types that
were in the sample. If the ion has a charge of one, then the
mass is calculated easily. Mathematically, a double-positively-charged
ion of mass 64 gives the same value of m/e as a single-positively-charged
ion of mass 32. Under the usual conditions for operating a
mass spectrometer most of the ions produced are singly charged.
A second technique would be to vary the accelerating
voltage while keeping the magnetic field constant. This has
the same result of sweeping the ion paths past the detector,
leading once again to a spectrum that can be analyzed for
ion masses and relative abundances.
A third type of mass spectrometry is time-of-flight
measurement in which the ions are produced in spurts and allowed
to diffuse toward the detector in a straight line. No magnetic
field is used, so the ions continue forward in a single direction.
The heavy ions move more slowly than the light ones, so they
arrive at the detector later. The mass spectrum is a plot
of intensity versus time of flight of the particle.
Interpreting the data from a mass spectrograph
is only one of many examples of the uses of algebraic equation-solving
in today's scientific world.
|
