NOTE: Click on the image to view it at its highest resolution.
Description from Rabinowitz and Butner:
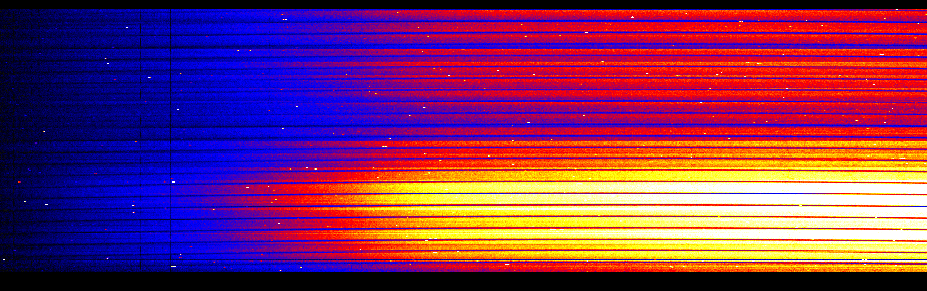
This image shows the spectrum of Io versus time during the impact of fragment B. The data are those reported by Harold Butner and I on July 17. The image represents wavelength on the x axis (the range is 0.4 to 0.6 microns), time on the y axis (02:47:31 to 03:07:02 UT 1994 July 17 UT) and intensity on the z axis (blue, red, yellow and white are increasing intensity values). The signal clearly shows an increase in relative intensity from 0.5 to 0.6 microns near the time of the B impact, and a subsequent decrease in the intensity a few minutes later.
We obtained these observations with the 2.5m Dupont Telescope at Las Campanas using a coronograph/spectrograph built by Steve Larson of the University of Arizona.
D. Rabinowitz
H. Butner
Las Campanas
1994 July 21
