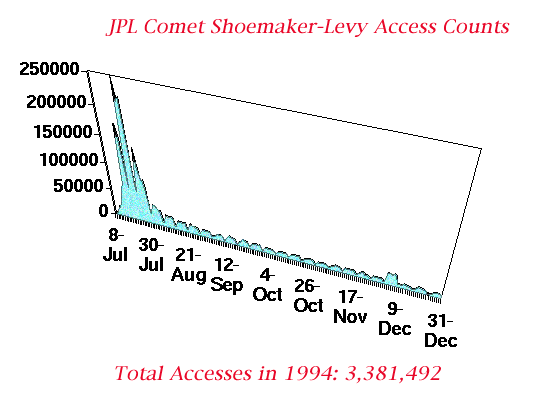
This access count is since July 8, 1994 and is current up through the end of May 6, 1996. Note that this number includes both the primary site on the Newproducts computer and from the mirror site at Navigator.jpl.nasa.gov. The access count is broken down by day and computer below.
Ron Baalke
Roger Lighty
Nick Christenson
     Date       Newproducts   Navigator      Total
   Jul 1994     1,660,420     256,437    1,916,857 (24 Days)
   Aug 1994       450,151      59,528      509,679 (31 Days)
   Sep 1994       234,469      24,833      259,302 (30 Days)
   Oct 1994       206,194        ----      206,194 (31 Days)
   Nov 1994       218,224        ----      218,224 (30 Days)
   Dec 1994       271,236        ----      271,236 (31 Days)
   Jan 1995       185,155        ----      185,155 (31 Days)
   Feb 1995       142,138        ----      142,138 (28 Days)
   Mar 1995       150,078        ----      150,078 (31 Days)
   Apr 1995       142,292        ----      142,292 (30 Days)
   May 1995       140,445        ----      140,445 (31 Days)
   Jun 1995       181,550        ----      181,550 (30 Days)
   Jul 1995       160,141        ----      160,141 (31 Days)
   Aug 1995       169,948        ----      169,948 (31 Days)
   Sep 1995       187,792        ----      187,792 (30 Days)
   Oct 1995       247,243        ----      247,243 (31 Days)
   Nov 1995       538,169        ----      538,169 (30 Days)
   Dec 1995       542,023        ----      542,023 (31 Days)
   Jan 1996       474,527        ----      474,527 (31 Days)
   Feb 1996       361,908        ----      361,908 (29 Days)
   Mar 1996       305,122        ----      305,122 (31 Days)
   Apr 1996       266,712        ----      266,712 (30 Days)

   May 01 Wed       8,859
   May 02 Thu       8,741
   May 03 Fri       8.954
   May 04 Sat       8,335
   May 05 Sun       6,701
   May 06 Mon       2,874

   Total        7,280,401    340,798    7,621,199
   Daily Average   10,866       4,605      11,375
                (670 Days)   (74 Days)   (670 Days)


Comet Impact Week

   Totals During the Comet Impact Period of July 16-22, 1994

     Date       Newproducts   Navigator      Total
   Jul 16-22      977,818     146,112     1,123,930
   Daily Average  139,688      36,528       160,561
                  (7 Days)    (4 Days)     (7 Days)

1994 Totals
   Totals During 1994 (July 8 - December 31)

     Date       Newproducts   Navigator      Total
   1994 Total   3,040,694     340,798    3,381,492
   Daily Average   17,179       4,605       19,104
                (177 Days)   (74 Days)   (177 Days)

![]() Comet Shoemaker-Levy Home Page
Comet Shoemaker-Levy Home Page
Ron Baalke
ron@jpl.nasa.gov
