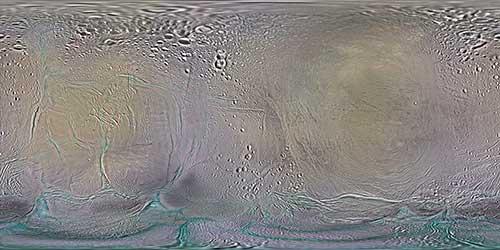
Color Map of Enceladus (2014)

| PIA Number | PIA18435 |
|---|---|
| Language |
|
This global color mosaic of Saturn's moon Enceladus was produced from images taken by NASA's Cassini spacecraft during its first 10 years exploring the Saturn system. These are the first global color maps of these moons produced from the Cassini data.
The yellowish and magenta tones in the map are believed to be due to differences in the thickness of surface deposits there. In addition, many of the most recently formed fractures on Enceladus have a stronger ultraviolet signature (meaning they are brighter), and they appear bluish in these maps. The famous "tiger stripe" fractures, which are the sources of the plumes venting gas and dust into space have a similar color. Researchers think this color could be due to large-grained ice exposed on the surface. Other subtle color markings are related to the moon's local and regional geologic history.
The colors shown in these global mosaics are enhanced, or broader, relative to human vision, extending into the ultraviolet and infrared range.
Resolution on Enceladus in the maps is 100 meters per pixel.
Image selection, radiometric calibration, geographic registration and photometric correction, as well as mosaic selection and assembly were performed by Paul Schenk at the Lunar and Planetary Institute. Original image planning and targeting for Saturn's icy moons were performed by Tilman Denk (Frei Universitat, Berlin) and Paul Helfenstein (Cornell University, Ithaca, New York).
Credit: NASA/JPL-Caltech/Space Science Institute/Lunar and Planetary Institute
