Storm Head, Meet Tail

| PIA Number | PIA16639 |
|---|---|
| Language |
|
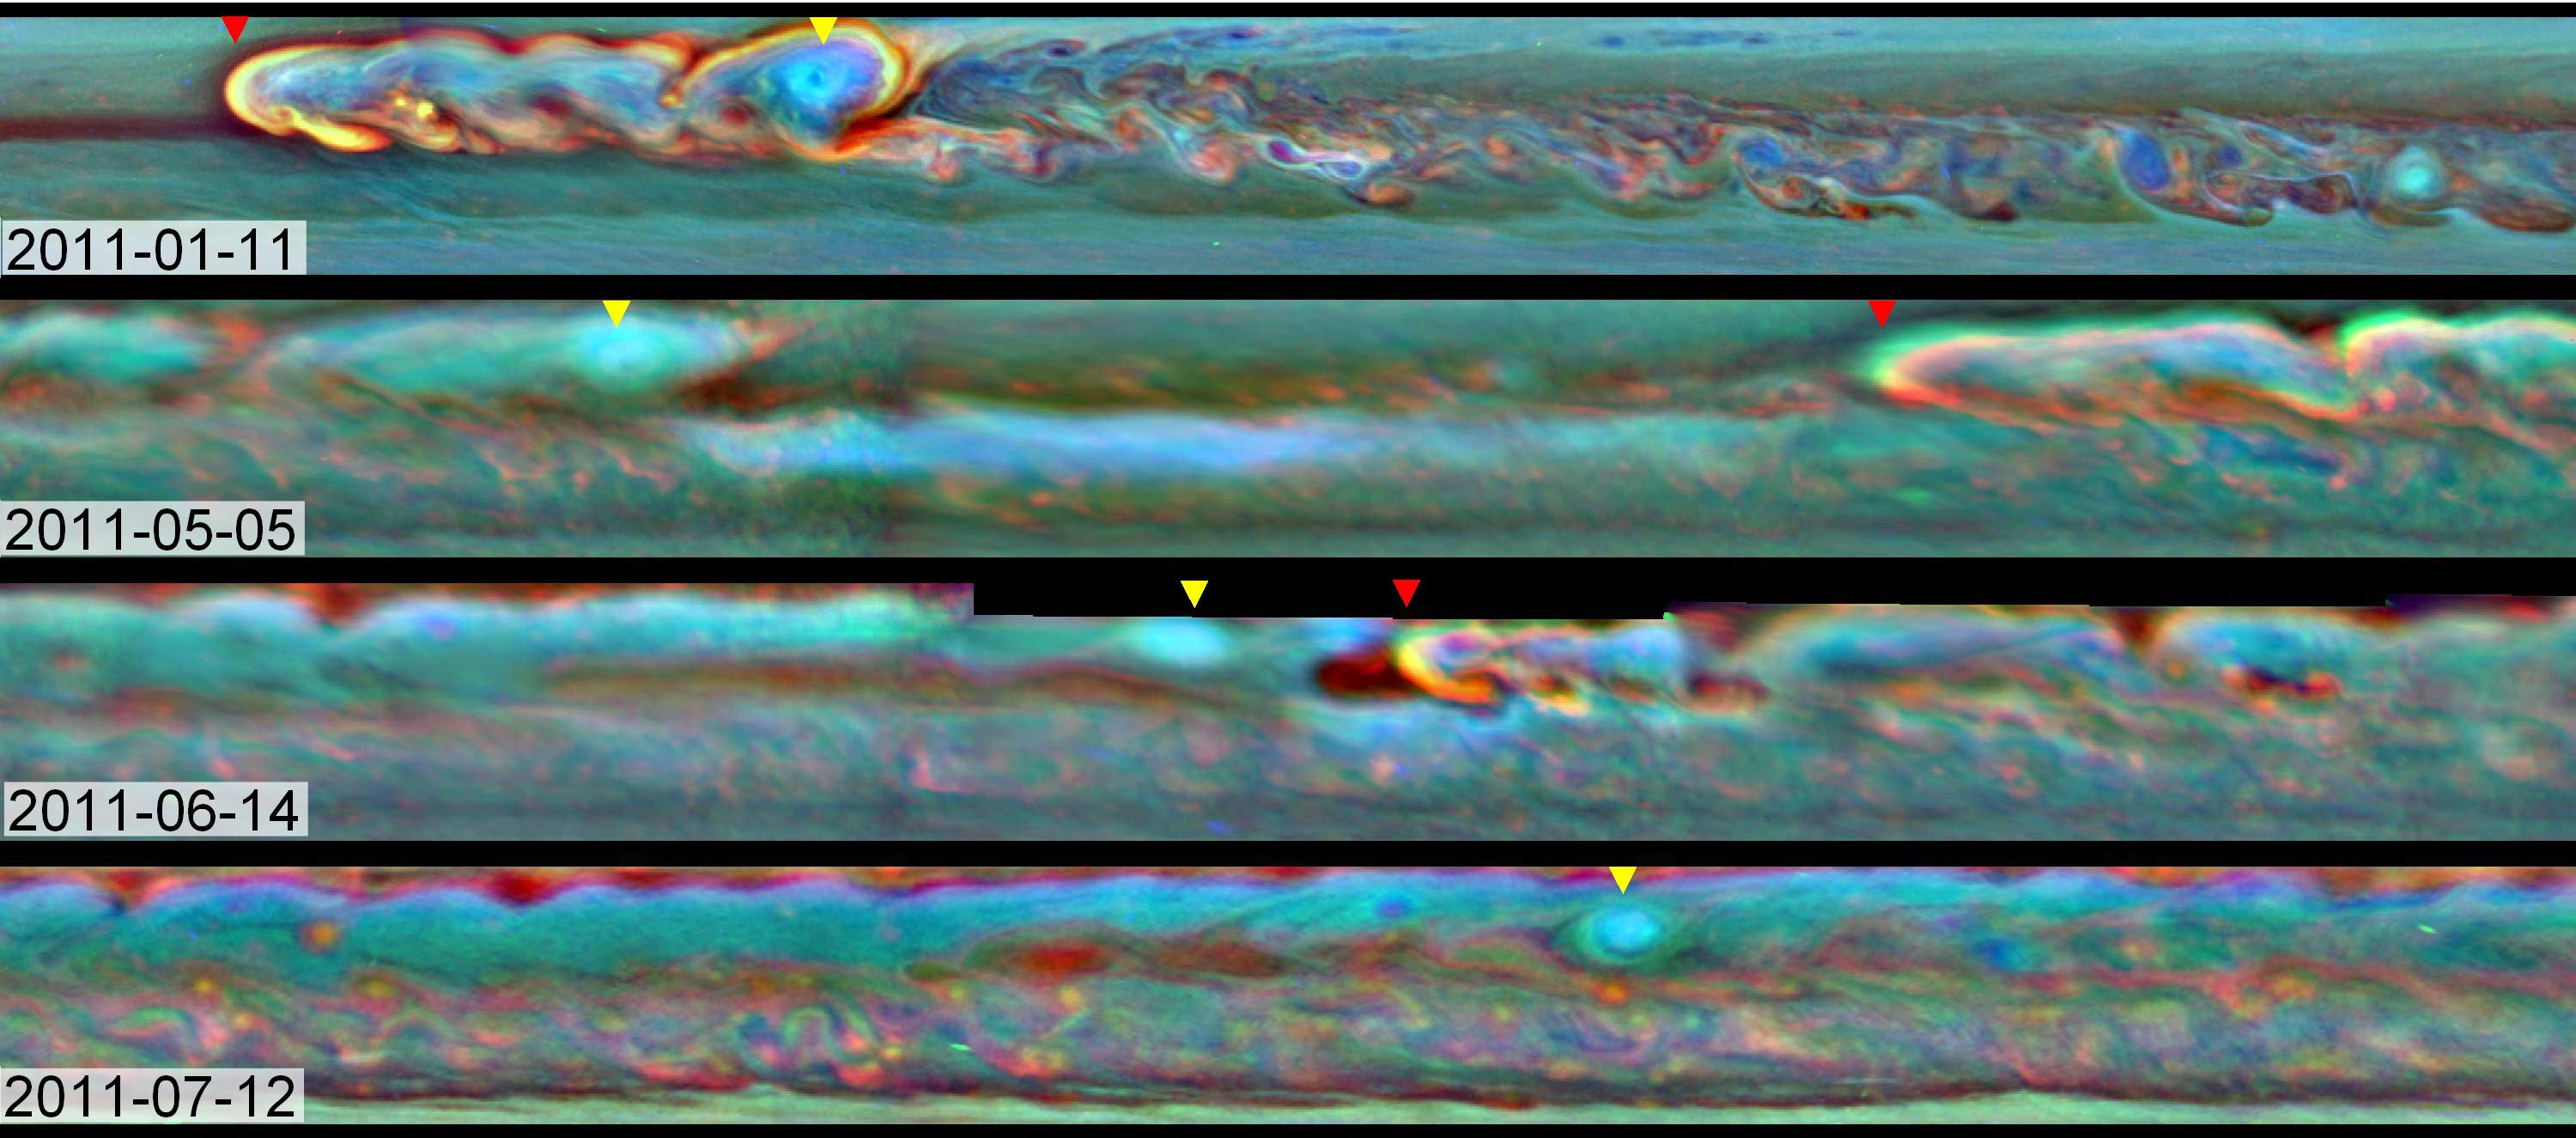
This set of images from NASA's Cassini mission shows the evolution of a massive thunder-and-lightning storm that circled all the way around Saturn and fizzled when it ran into its own tail. The storm was first detected on Dec. 5, 2010. That month, it developed a head of bright clouds quickly moving west and spawned a much slower-drifting clockwise-spinning vortex.
In the annotated images, the bright clouds at the head of the storm are indicated with a red triangle. A yellow triangle indicates the vortex.
An unannotated version is also available.
The top image was taken on Jan. 22, 2011, shortly after the start of the storm, showing the bright head of the storm just ahead of the vortex by about 25,000 miles (40,000 kilometers). The second image shows that, on May 5, 2011, the head of the storm has traveled around the planet and started approaching the vortex from the east. The storm's body stretched 140,000 miles (224,000 kilometers), and the head was within about 51,000 miles (82,000 kilometers) of catching up to the vortex. This image also shows how quickly the vortex lost steam, shrinking and losing its bright clouds, compared to the still-raging head of the storm. By the third image, taken on June 14, 2011, the head of the storm had made its way almost entirely around the planet, about 183,000 (292,000 kilometers) miles ahead of the vortex in a westward direction, and it was about to catch up with the vortex. The head of the storm was just 8,700 miles (14,000 kilometers) to the east of the vortex at this time. The bottom image, from July 12, 2011, shows how the storm fizzled once the head and vortex collided. Only the vortex remains in that picture, while the bright cloud has disappeared. By late August, that band around Saturn stopped thundering and throwing lightning for good, though there continues to be turbulence in higher parts of the atmosphere.
Cassini's imaging science subsystem obtained these false color images. Here, the colors denote the altitudes of the clouds – with red being the lowest, green being an intermediate level and blue being the highest. White indicates thick clouds at a high altitude. Scientists assigned the red color channel to a wavelength of radiation that penetrates the atmosphere deep down to the top of the tropospheric cloud deck (750 nanometers). Green represents an intermediate wavelength above the troposphere (728 nanometers). Blue was assigned to a wavelength that penetrates only to the top of tropospheric haze (890 nanometers).
The Cassini-Huygens mission is a cooperative project of NASA, the European Space Agency and the Italian Space Agency. NASA's Jet Propulsion Laboratory, a division of the California Institute of Technology in Pasadena, manages the mission for NASA's Science Mission Directorate, Washington. The Cassini orbiter and its two onboard cameras were designed, developed and assembled at JPL. The imaging operations center is based at the Space Science Institute in Boulder, Colo.
For more information about the Cassini-Huygens mission, visit http://www.nasa.gov/cassini and http://saturn.jpl.nasa.gov/.
Credit: NASA/JPL-Caltech/SSI/Hampton University
