


Cassini
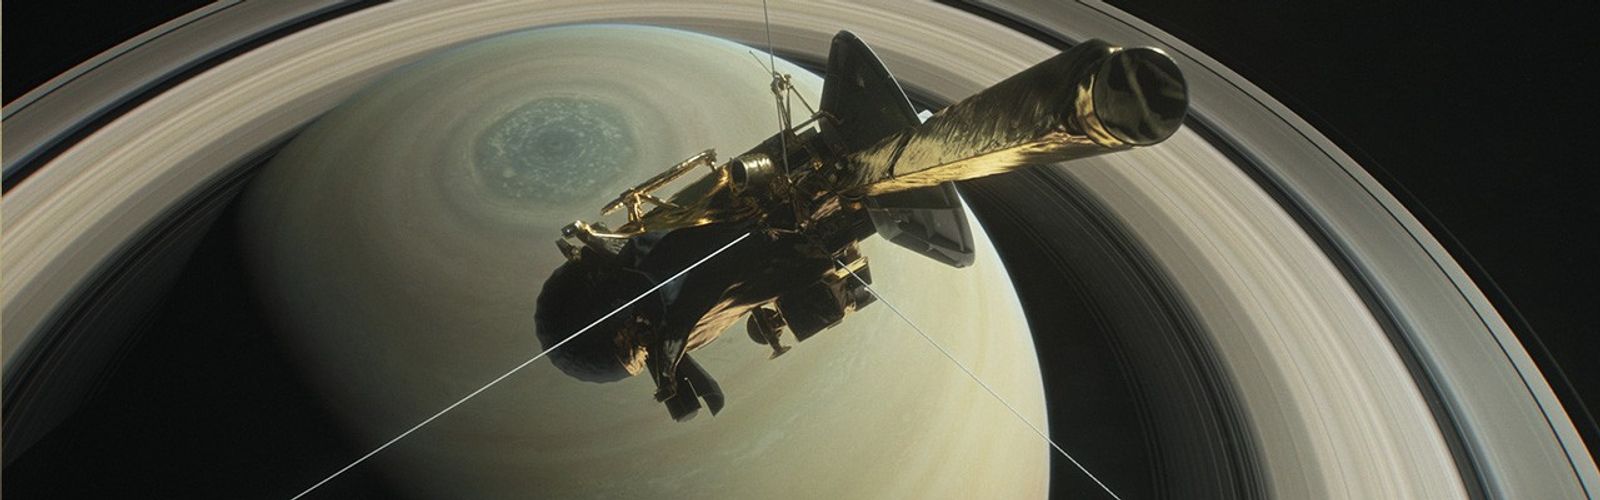
How It Worked
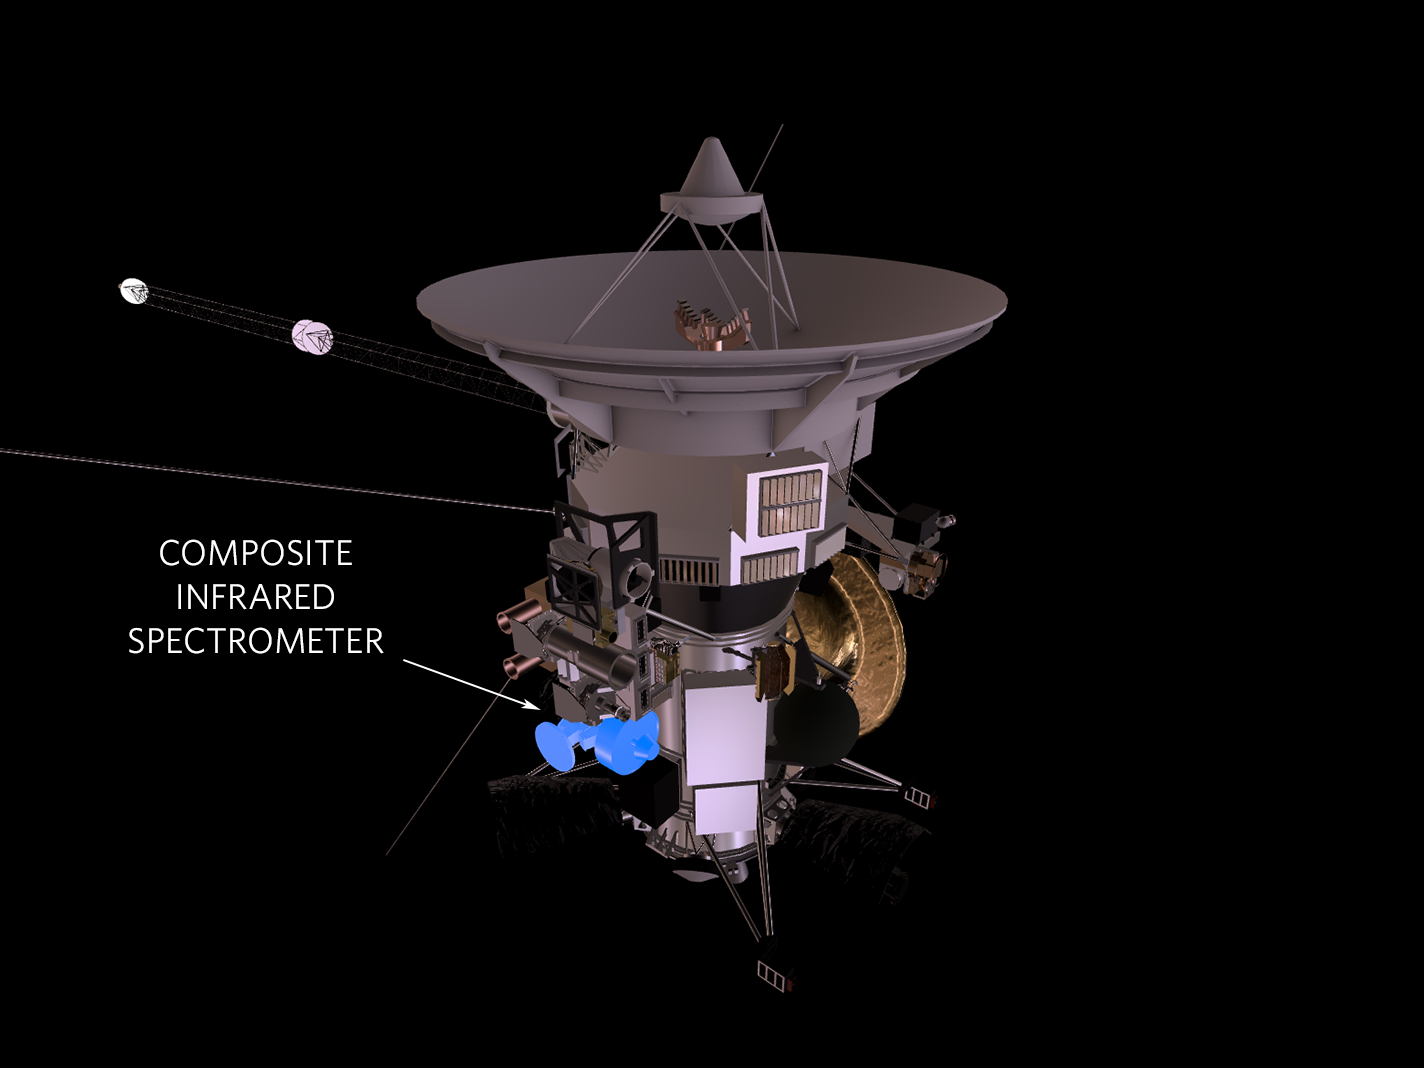
Cassini’s Composite Infrared Spectrometer, or CIRS, captured infrared light and split the light into its component wavelengths (or colors) and then measured the strength of the light at each of those wavelengths primarily to measure the temperature of objects, but also their composition.
How We Used It
By studying the temperatures, as well as the composition of features in the Saturnian system, scientists can study the miriad properties of Saturn’s moons and can learn about how seasons affect Saturn’s atmosphere and rings.
loading cassini spacecraft...
Our sun and other stars aren’t the only things that naturally emit light. Humans do too, and so does everything else in the universe that’s not at a temperature of absolute zero. But because humans are nowhere near as hot as the sun, we emit lower-energy forms of light, at infrared wavelengths. The same is true of Saturn’s clouds, rings and moons.
Spectrometers use lenses, mirrors, and other hardware to dissassemble light into its component wavelengths, similar to how raindrops spread the sun’s light into a rainbow. Cassini’s infrared spectrometer performed the same trick but at infrared wavelengths of light instead of visible wavelengths.
CIRS measured the infrared thermal radiation from planetary targets, be it atmospheres, surfaces, or ring particles. Because of this, it functioned as a remote-sensing thermometer, and determined the targets’ temperatures. It also determined the chemical composition of the targets because the various molecules leave different “fingerprints" in the observed spectrum -- they preferentially absorb and emit infrared radiation at different specific wavelengths in the spectrum. In other words, their presence shows up as different lines in the spectrum.
By analyzing an object’s light with a spectrometer, scientists can determine its temperature and some of the materials it’s made of. When pointed at Saturn’s atmosphere, for example, a spectrometer would reveal a series of bright lines indicating that the spectrometer observed methane gas.
“If you think about a rainbow, water drops take sunlight and split it up into different colors – a spectrum. That’s what we do for heat,” explained Conor Nixon, a space scientist at NASA’s Goddard Space Flight Center who is on the Cassini CIRS team. "By measuring the infrared spectrum we can tell what gases are in the atmosphere, and how much of each one."
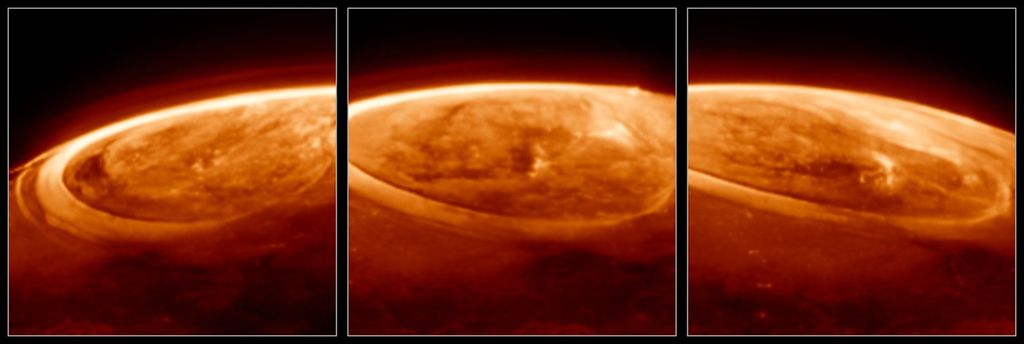
The atmospheres of Saturn, and its moon Titan, are composed of different gases distributed in layers upon layers of varying temperatures that decrease and increase from the surface up into space. Data from the instrument helps scientists determine what those atmospheric layers are composed of and how warm they are.
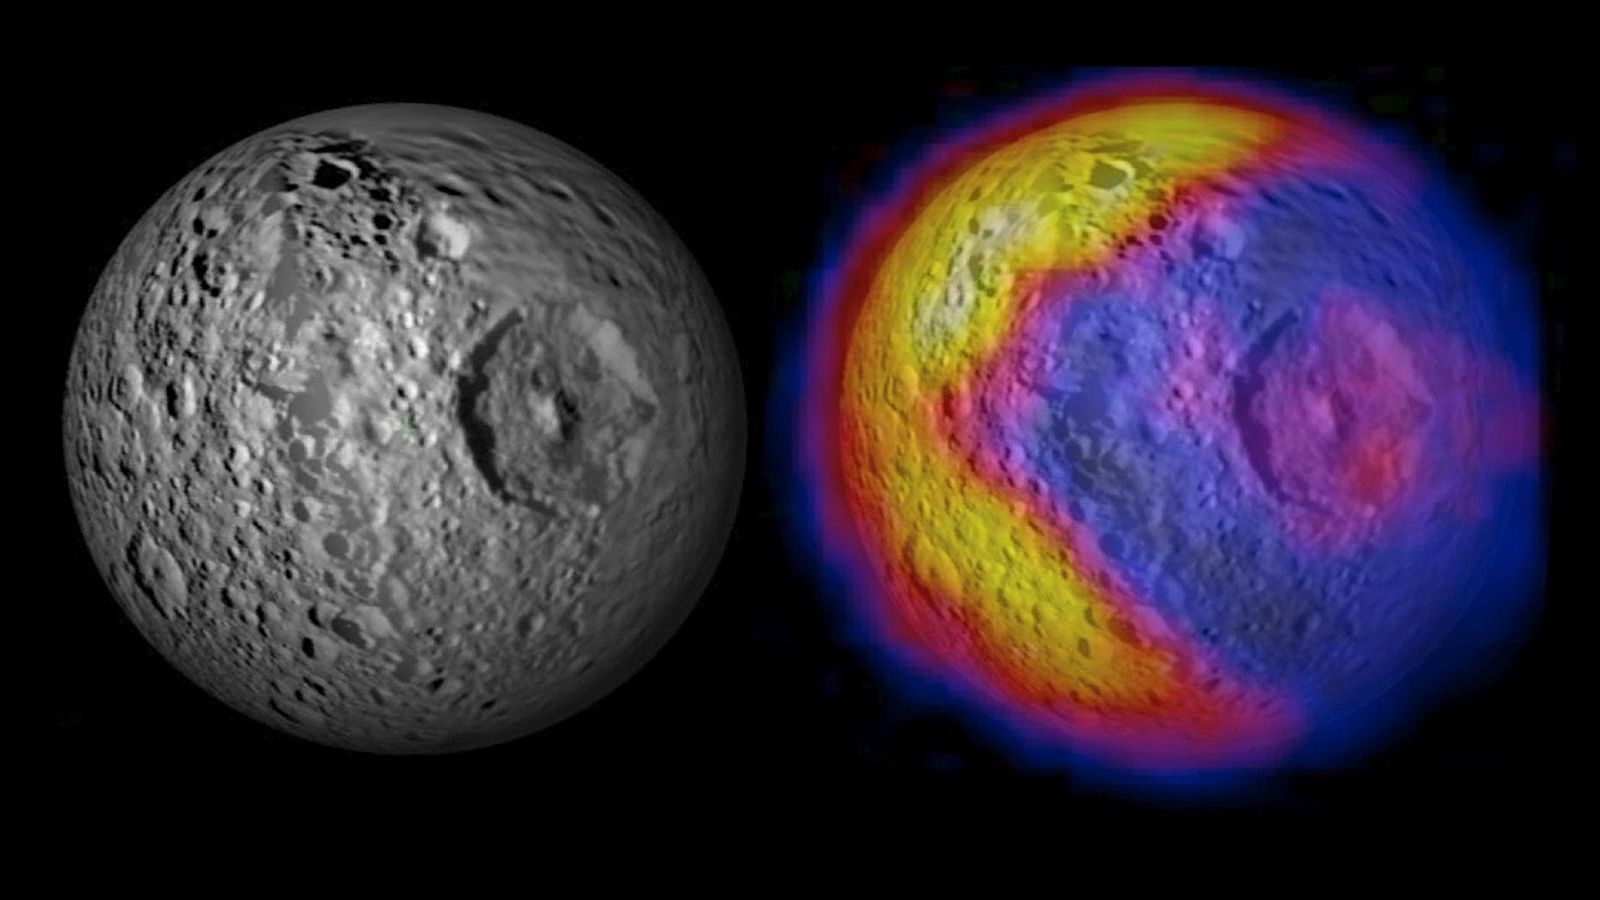
CIRS has also helped decipher the mystery of the plume jetting out of Saturn’s moon Enceladus. The water jets spraying out from the moon’s south polar region originate from cracks in Enceladus’ water-ice surface. “The cracks were seen by the Cassini imaging cameras (ISS), but CIRS was able to tell that they are much hotter than the surroundings," Nixon said. “The unique thing about CIRS is we can see these cracks glowing, tell their temperature, and estimate how much heat Enceladus is losing.” The amount of heat being given off by Enceladus has important implications for its potential habitability for simple forms of life.
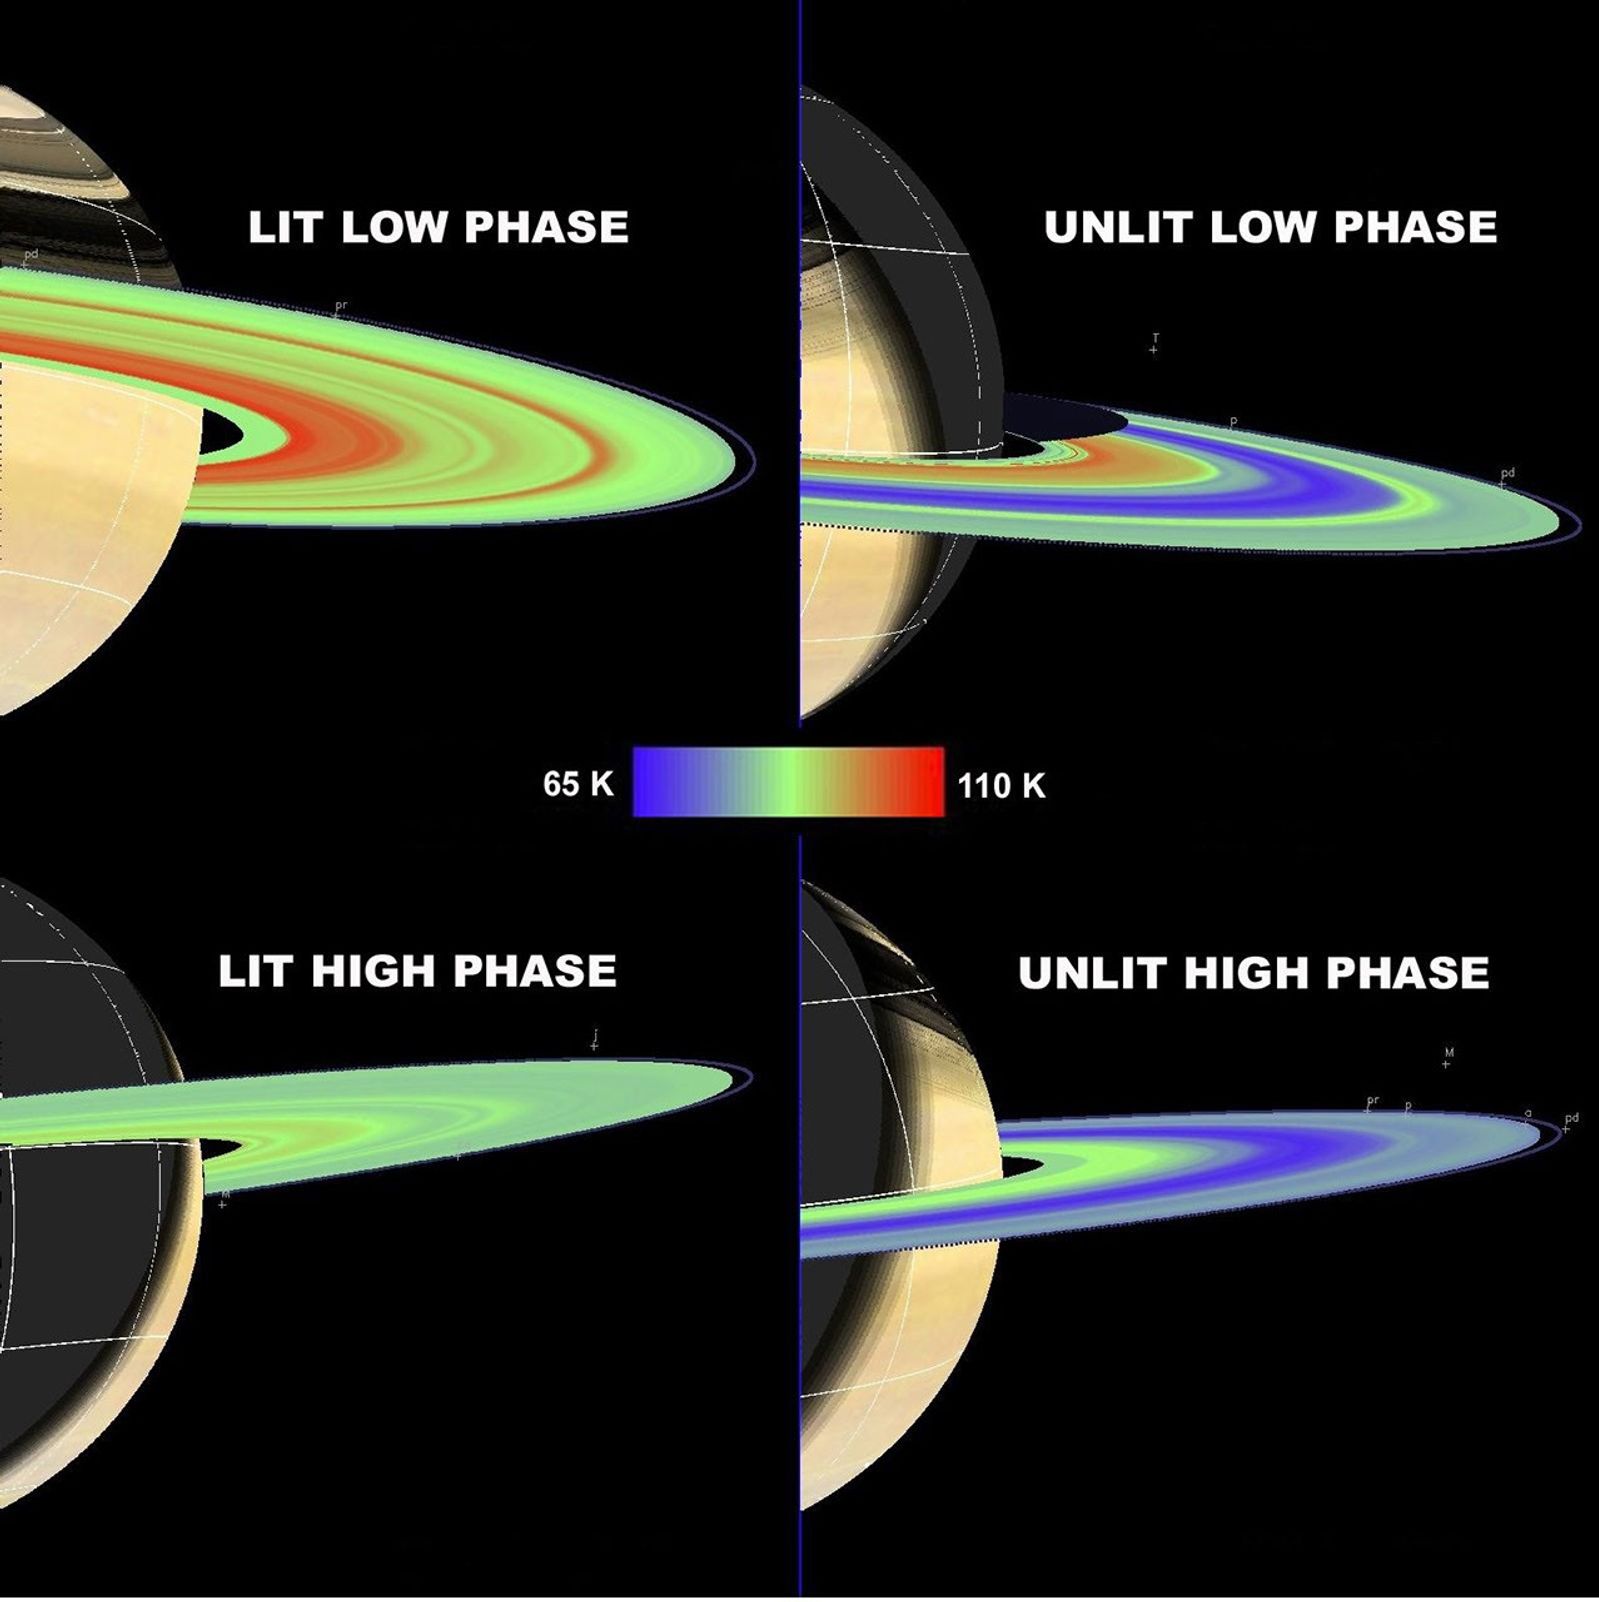
CIRS took the temperature of the rings throughout the mission to learn about their composition and structure, including insights into the structure of individual particles. This included the brief period during Saturn’s equinox, when the sunlight moved from the north to the south side of the ringplane, allowing the rings to cool extensively.
At A Glance
CIRS is a spectrometer, which means that it split light into different colors, like a glass prism, or a raindrop creating a rainbow. CIRS was special because it was sensitive to invisible heat rays, or infrared light, rather than ordinary visible light. CIRS measured the strength of the different colors, or 'wavelengths' of heat rays, given off by a planet.
CIRS Sensing Instruments:
- Far-Infrared Focal Plane [FP1] (16.67 to 1000 µm; 4.3 mrad circular field of view)
- Mid-Infrared Focal Plane [FP3] (9.09 to 16.67 µm; 1x10 array of 0.273 mrad squares)
- Mid-Infrared Focal Plane [FP4] (7.16 to 9.09 µm; 1x10 array of 0.273 mrad squares)
CIRS Instrument Characteristics:
- Mass (current best estimate) = 39.24 kg
- Peak Operating Power (current best estimate) = 32.89 W
- Average Operating Power (current best estimate) = 26.37 W
- Peak Data Rate (current best estimate) = 6.000 kilobits/sec
- Dimensions (approximate) = 50-cm diameter telescope; 89 cm x 76 cm x 52 cm
Cassini Orbiter Instruments
They surveyed and sniffed, analyzed and scrutinized. They took stunning images in various visible spectra. Cassini's 12 science instruments were designed to carry out sophisticated scientific studies of Saturn, from collecting data in multiple regions of the electromagnetic spectrum, to studying dust particles, to characterizing Saturn's plasma environment and magnetosphere.
Optical Remote Sensing
Mounted on the remote sensing pallet, these instruments studied Saturn and its rings and moons in the electromagnetic spectrum.
- Composite Infrared Spectrometer (CIRS)
- Imaging Science Subsystem (ISS)
- Ultraviolet Imaging Spectrograph (UVIS)
- Visible and Infrared Mapping Spectrometer (VIMS)
Fields, Particles and Waves
These instruments studied the dust, plasma and magnetic fields around Saturn. While most didn't produce actual "pictures," the information they collected is critical to scientists' understanding of this rich environment.
- Cassini Plasma Spectrometer (CAPS)
- Cosmic Dust Analyzer (CDA)
- Ion and Neutral Mass Spectrometer (INMS)
- Magnetometer (MAG)
- Magnetospheric Imaging Instrument (MIMI)
- Radio and Plasma Wave Science (RPWS)
Microwave Remote Sensing
Using radio waves, these instruments mapped atmospheres, determined the mass of moons, collected data on ring particle size, and unveiled the surface of Titan.